Solution
Data visualisation interfaces
Dashboards grow until nothing stands out. We design views around the decision they support.
Typical problem
Everything has the same weight
Charts accumulate. Live views stutter as data grows. The one number that matters (a threshold crossed, an outlier, a turning trend) weighs the same as twenty that don’t.
You may recognise
- People export to spreadsheets to read the data
- Views slow as data grows
- Alerts get missed
Approach
Start from the decision
We ask which decision the view supports, then split foreground from context. Rendering follows volume: SVG for hundreds of marks, Canvas for thousands, WebGL beyond.
Every view gets a text alternative or table: a chart that only works for sighted mouse users isn’t finished.
At handover
What a good view gives you
-
The important value first
Visual hierarchy that follows the decision, not the database.
-
Responsive at volume
Rendering matched to data size and tested on your users’ hardware.
Work
Projects close to this problem
Built by the studio itself and labelled with their status. None is client work.
-
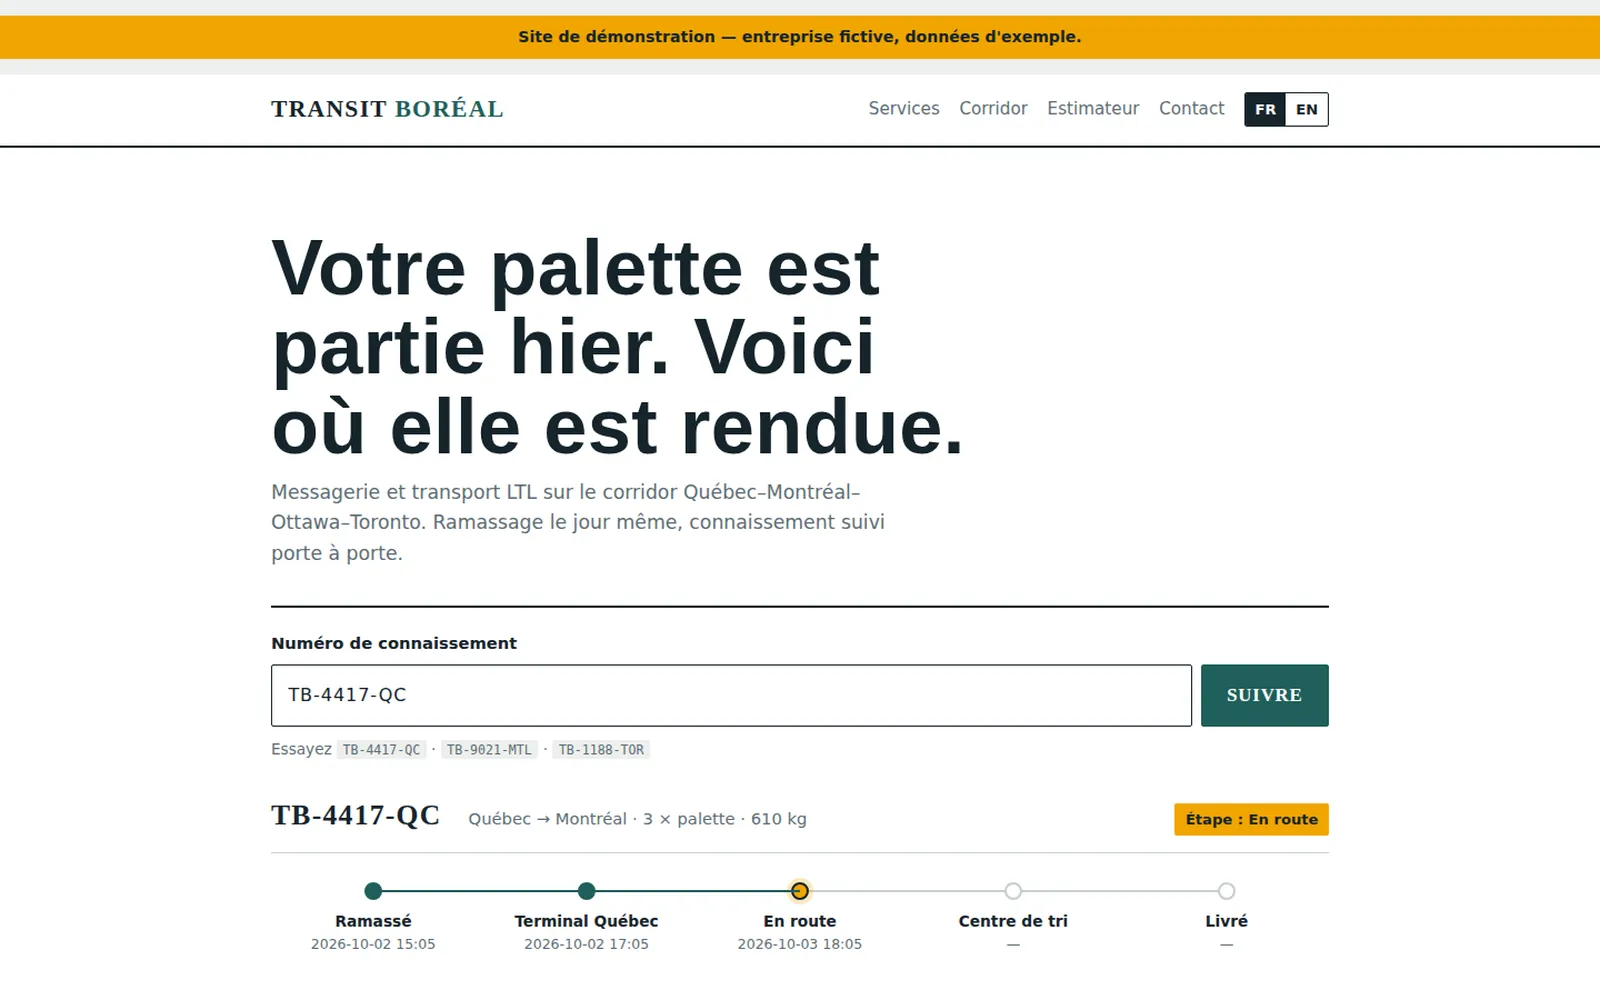
Transit Boréal
A bilingual site for a Québec–Toronto carrier with waybill tracking, a server-priced rate estimator and a staff console, on Cloudflare Pages and D1. : Transit Boréal -
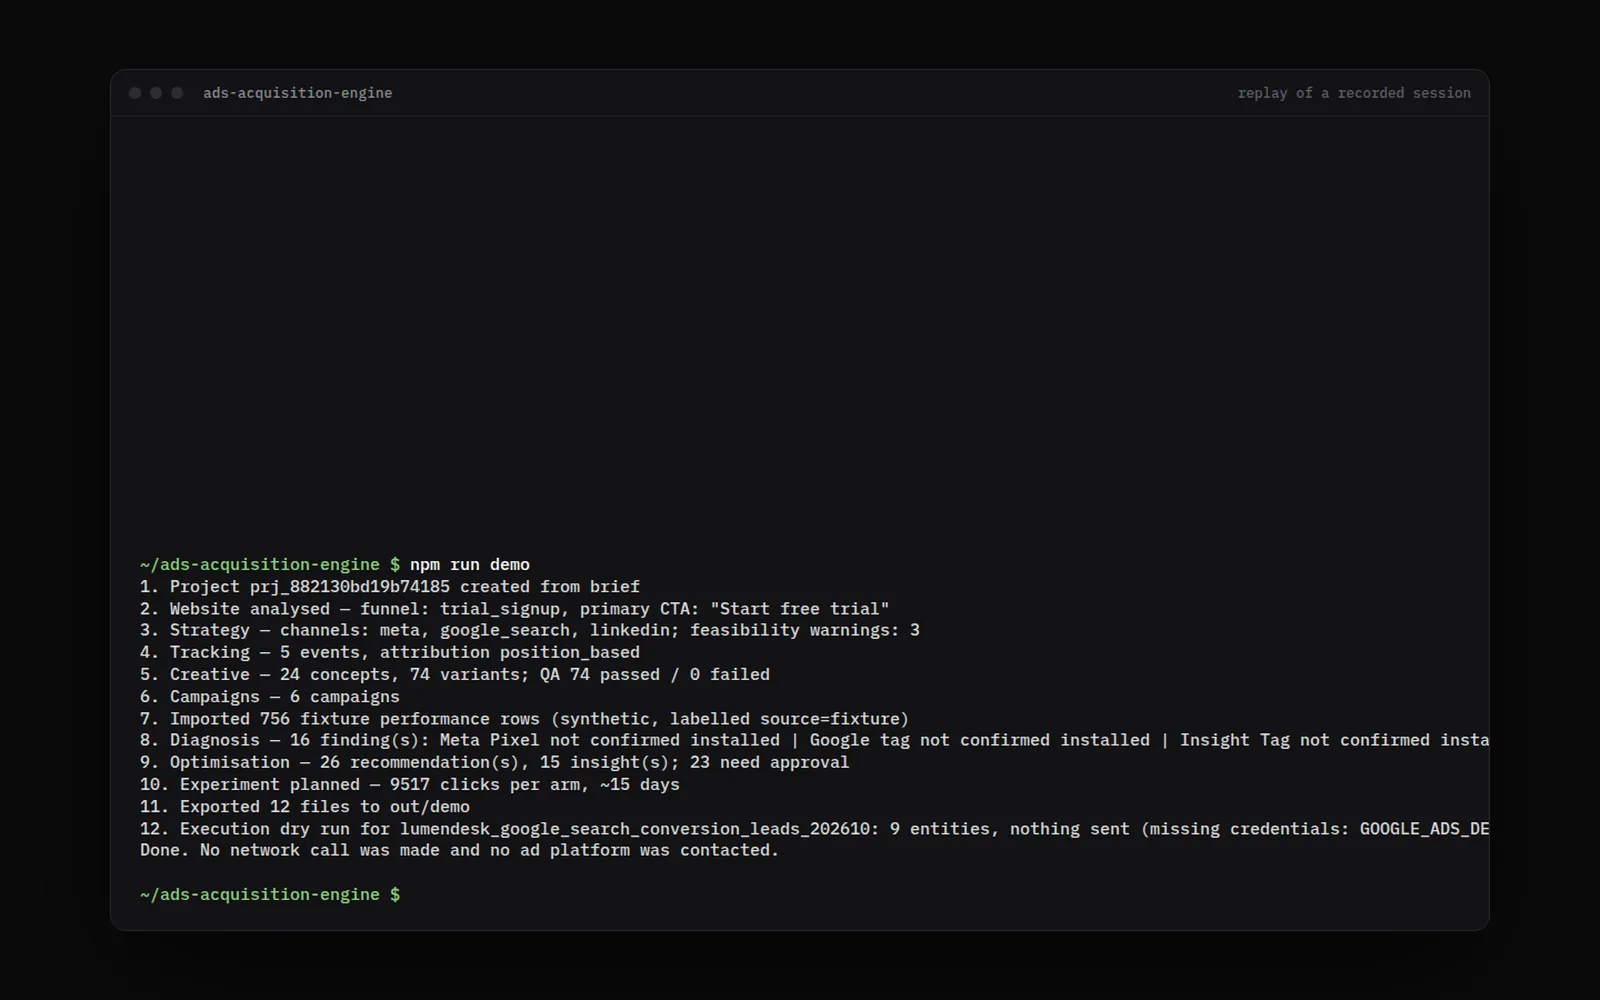
Ads Acquisition Engine
An offline-first TypeScript engine that turns a brief and a website into a paid-acquisition plan — strategy, tracking, creative with QA, campaigns, experiments and diagnosis — through a CLI, an HTTP API and an MCP server. : Ads Acquisition Engine
Fit
When to call us, and when not to
Worth a conversation if
- Operational or monitoring tools
- Data-heavy product features
Probably not if
- Reporting an off-the-shelf BI tool already covers
Services
Services this draws on
FAQ
Questions people ask about this
Which technologies do you use?
HTML and CSS first, then JavaScript or TypeScript, static generation where we can, and WebGL (Three.js or our own GLSL) and GSAP when real-time graphics or motion are worth their weight. Technology explains the choices.
Is accessibility included?
Yes, it’s part of every project. We work to WCAG 2.2 AA and test with automated checks, the keyboard and a screen reader.
Have data that people can’t read?
Tell us what you need and by when. We read every enquiry and reply in writing, with questions, a next step, or a plain no if we’re the wrong studio.